Used Car Reliability Ratings & Rankings by Model Year
Find the model years worth buying and the ones to avoid. Our reliability rating system scores every model year from 0 to 100, based on the owner complaints and recalls on file with NHTSA, and compares it with the average car of the same age.
71,410 owner complaints read121 model years rated215 recalls matchedNHTSA data as of Sep 17, 2026
Models & Years to Buy
Model years rated Excellent or Good by our rating system, ranked from the highest score down. Here are the top 10. The ranking updates itself whenever we add a model or new data arrives.
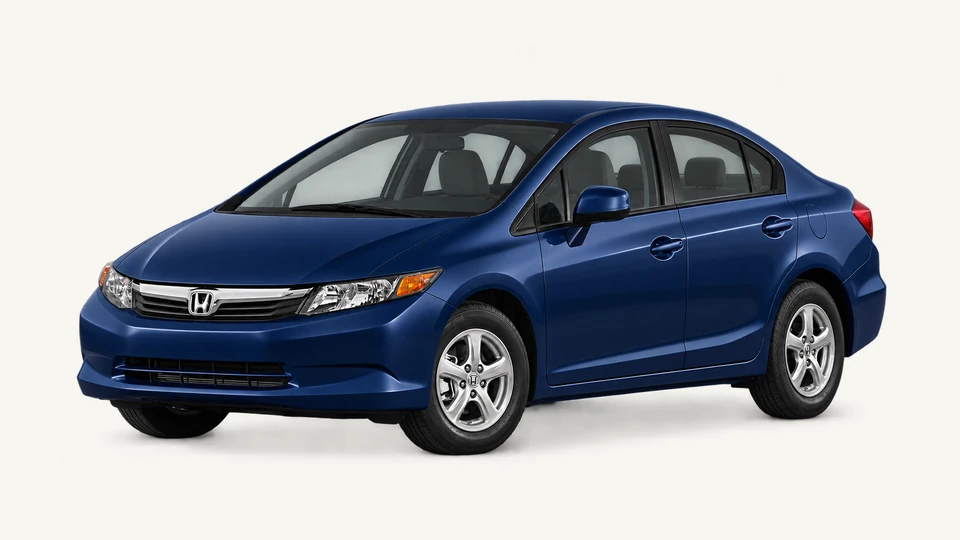
- #12013 Honda CivicExcellent329 complaints · 0 recalls89
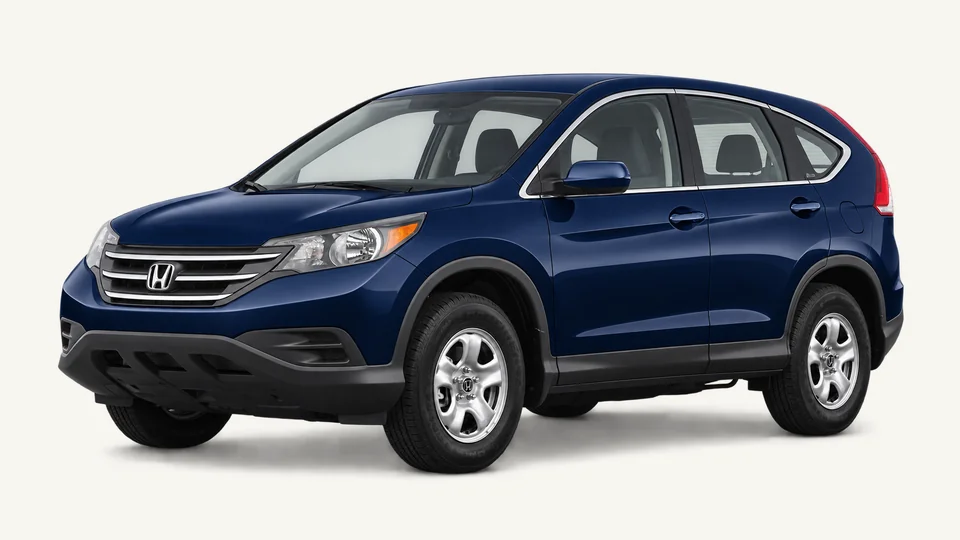
- #22014 Honda CR-VExcellent587 complaints · 1 recall89
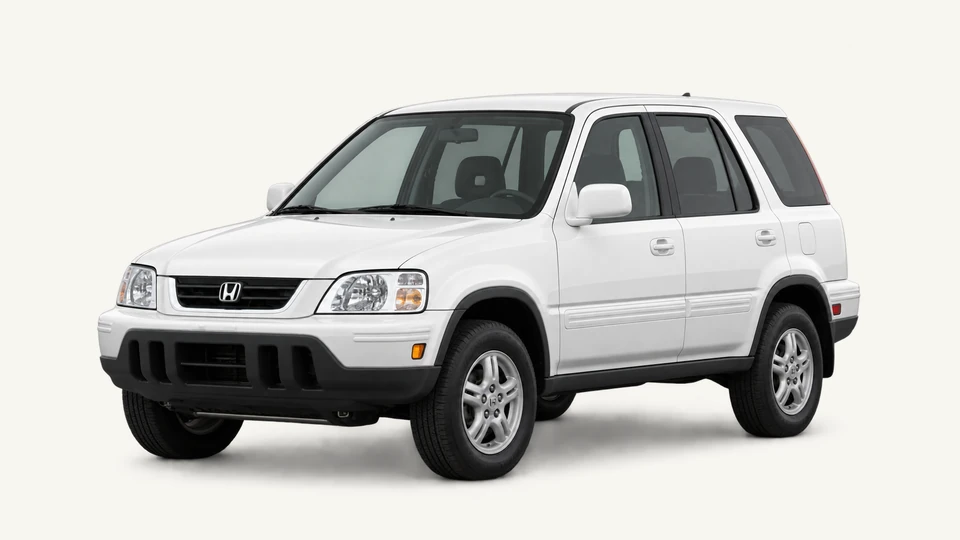
- #32001 Honda CR-VExcellent142 complaints · 1 recall87
- #42000 Honda CR-VExcellent129 complaints · 2 recalls87
- #52013 Honda CR-VExcellent382 complaints · 2 recalls85
- #62014 Honda CivicExcellent296 complaints · 2 recalls85
- #72016 Honda CR-VExcellent392 complaints · 3 recalls84
- #82015 Honda CivicExcellent393 complaints · 1 recall84
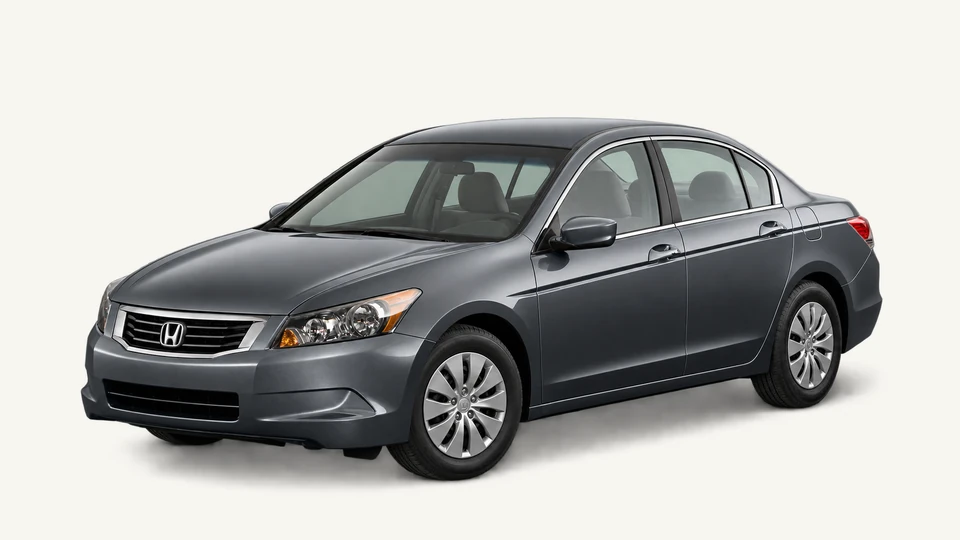
- #92012 Honda AccordExcellent373 complaints · 8 recalls84
- #102012 Honda CivicExcellent472 complaints · 4 recalls84
Models & Years to Avoid
Model years rated Avoid, with a score below 60, ranked from the lowest score up. Each one had more than twice the problems of the average car its age.
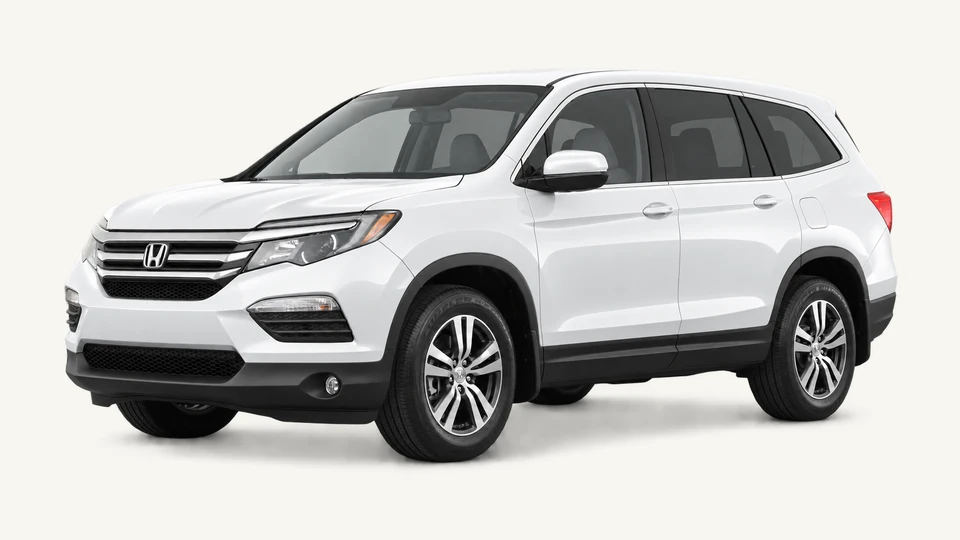
- #12016 Honda PilotAvoid1,699 complaints · 8 recallsMost reported: Auto idle stop system: the car not starting52
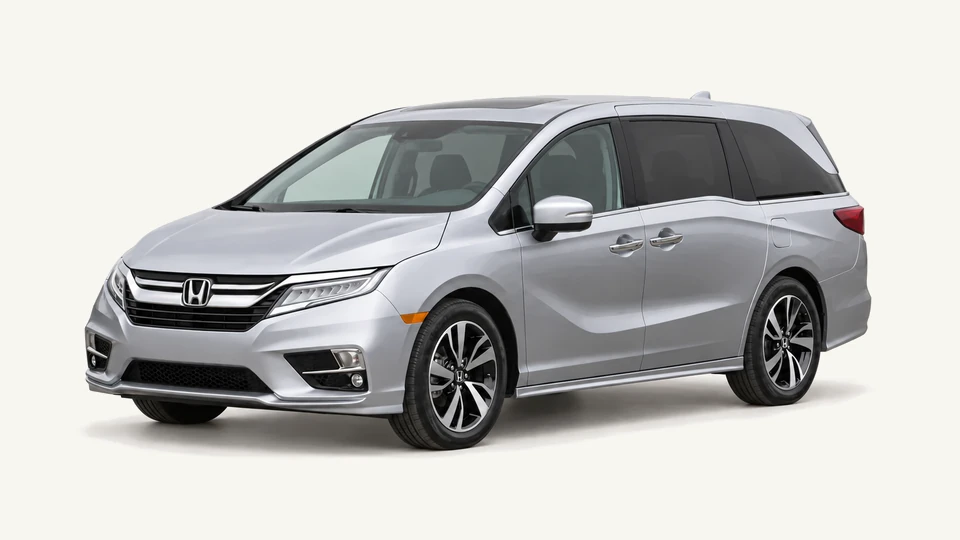
- #22018 Honda OdysseyAvoid985 complaints · 16 recallsMost reported: Driver-assist camera and radar failure54
- #32019 Honda OdysseyAvoid960 complaints · 20 recallsMost reported: Driver-assist camera and radar: stopped working55
- #42020 Honda OdysseyAvoid465 complaints · 14 recallsMost reported: Driver-assist camera and radar: stopped working58
- #52019 Honda PilotAvoid903 complaints · 13 recallsMost reported: Car not starting (cause not stated)58
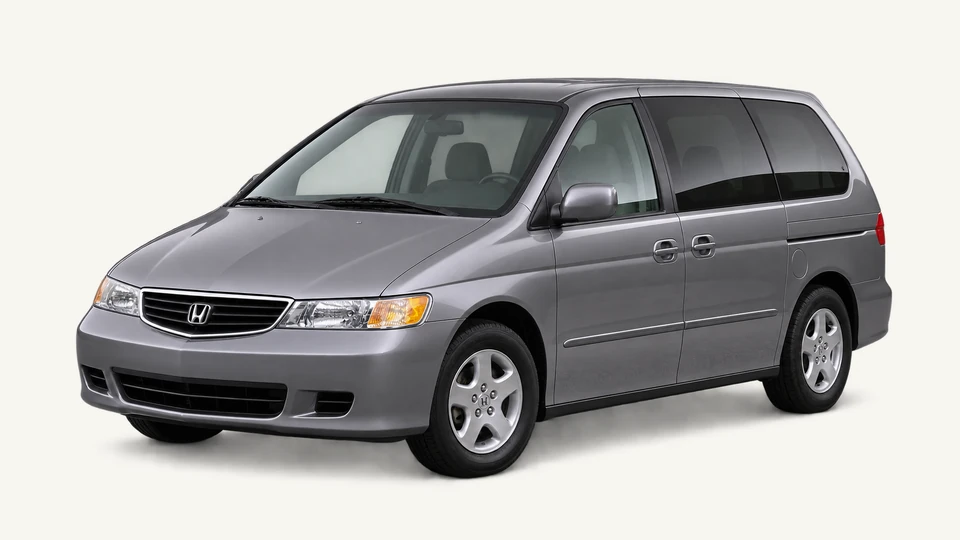
- #62002 Honda OdysseyAvoid960 complaints · 10 recallsMost reported: Transmission: failure or loss of drive59
- #72017 Honda PilotAvoid920 complaints · 4 recallsMost reported: Auto idle stop system: the car not starting59
- #82003 Honda OdysseyAvoid914 complaints · 15 recallsMost reported: Transmission: failure or loss of drive59
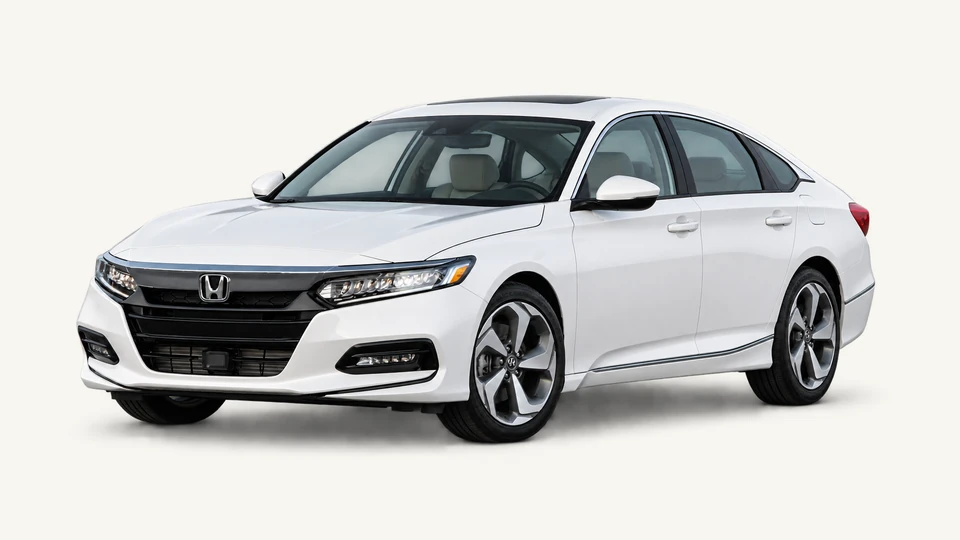
- #92018 Honda AccordAvoid1,990 complaints · 6 recallsMost reported: Cylinder head gasket failure59
Our Reliability Score System: How We Score Each Model & Year
- 1
We Count What Owners Report to NHTSA
Every complaint for the model year, sorted into serious problems, such as crashes, fires, injuries, stalls and loss of control, and everyday ones. Filings that only report a recall notice, with no fault, are left out.
- 2
We Adjust for How Many Were Made
A popular car gets more complaints just because there are more of them. We divide by the number of cars the automaker reports making for the U.S. for that exact model year.
- 3
We Compare With Cars the Same Age
Older cars draw more complaints. Each year is measured against the average car at the same age, so a 2012 and a 2022 are judged fairly.
- 4
We Turn It Into One Score
Matching the average car scores 70. Twice the average rate of complaints costs 10 points, and half the rate adds 10. Serious problems, the last two years and recalls are weighed in.
The Rating Scale
70 is average for a car of the same age. Twice the average rate of complaints costs 10 points.
Excellent
Score 80 or higher. About half the problems of the average car its age, or fewer.
Good
Score 70 to 79. Up to an average number of problems for its age.
Caution
Score 60 to 69. Up to twice the problems of the average car its age.
Avoid
Score below 60. More than twice the problems of the average car its age.
Everything You Need Before You Buy
Independent Ratings and Rankings From Public Data
Car Reliability Rankings rates every model year from 0 to 100 with its own reliability rating system, using only public data. No automaker pays for a score or a placement, and no score is changed by hand. Each score looks at serious problems, everyday problems, complaints from the last two years and recalls, and compares the car with the average car of the same age, adjusted for how many were made.
Today we cover 132 model years of the Honda CR-V, Accord, Civic, Pilot and Odyssey, from 2000 to 2026, and 121 of those years have a final score. We also read every owner complaint, one by one, to show which problems owners report most for each year.
More about us →Frequently Asked Questions
What Is Car Reliability Rankings?
An independent site that rates and ranks used cars by model year with its own reliability rating system, based on public NHTSA data. Each model year gets a score from 0 to 100, and the rankings put every year we score in order. It is free, and no automaker pays for a score or a placement.
How Is the Reliability Score Calculated?
The score has four parts: serious problems count for 35%, everyday problems for 15%, complaints about major systems in the last two years for 30%, and recalls for 20%. Each part compares the car with the average car of the same age, adjusted for how many were made. Matching the average scores 70, and every doubling of the complaint rate costs 10 points. Read the full method.
What Do Excellent, Good, Caution and Avoid Mean?
Excellent: score 80 or higher. About half the problems of the average car its age, or fewer. Good: score 70 to 79. Up to an average number of problems for its age. Caution: score 60 to 69. Up to twice the problems of the average car its age. Avoid: score below 60. More than twice the problems of the average car its age.
Where Does the Data Come From?
Owner complaints, recalls and defect investigations come from NHTSA, the U.S. National Highway Traffic Safety Administration. Production counts come from the automaker's reports to NHTSA, and warranty extensions from the notices the automaker files with NHTSA. The scores themselves come from our rating system. The NHTSA data on this site is as of Sep 17, 2026.
Why Do the Newest Model Years Have No Score?
A final score needs 36 months of complaints. We count a model year's months from July of the year before its name, when model years usually go on sale, so a 2024 model reached 36 months in July 2026. Until then, a model year shows what owners and NHTSA have reported so far, and a provisional reading once there is enough data.
Does a Recall Make a Car Unreliable?
Not by itself. A recall is a safety fix the automaker makes for free. Recalls count for 20% of the score, compared with the average car of the same age, so one or two recalls cannot swing it far. Before you buy, check that every recall on the car was done: enter its VIN at nhtsa.gov/recalls.
What Is the Most Reliable Used Car in Your Rankings?
Of the 121 model years we rate, the 2013 Honda Civic ranks first, with 89 out of 100. The 2014 Honda CR-V comes next, with 89. See every model year to buy.
Which Used Car Model Years Should I Avoid?
The lowest-scoring model years we track are the 2016 Honda Pilot (52), 2018 Honda Odyssey (54) and 2019 Honda Odyssey (55). A low score does not mean every car is bad, but problems are more likely. See every year to avoid.
Is This Site Affiliated With an Automaker or NHTSA?
No. Car Reliability Rankings is an independent project. It is not affiliated with NHTSA or any automaker, and none of them pays for a score or a placement.